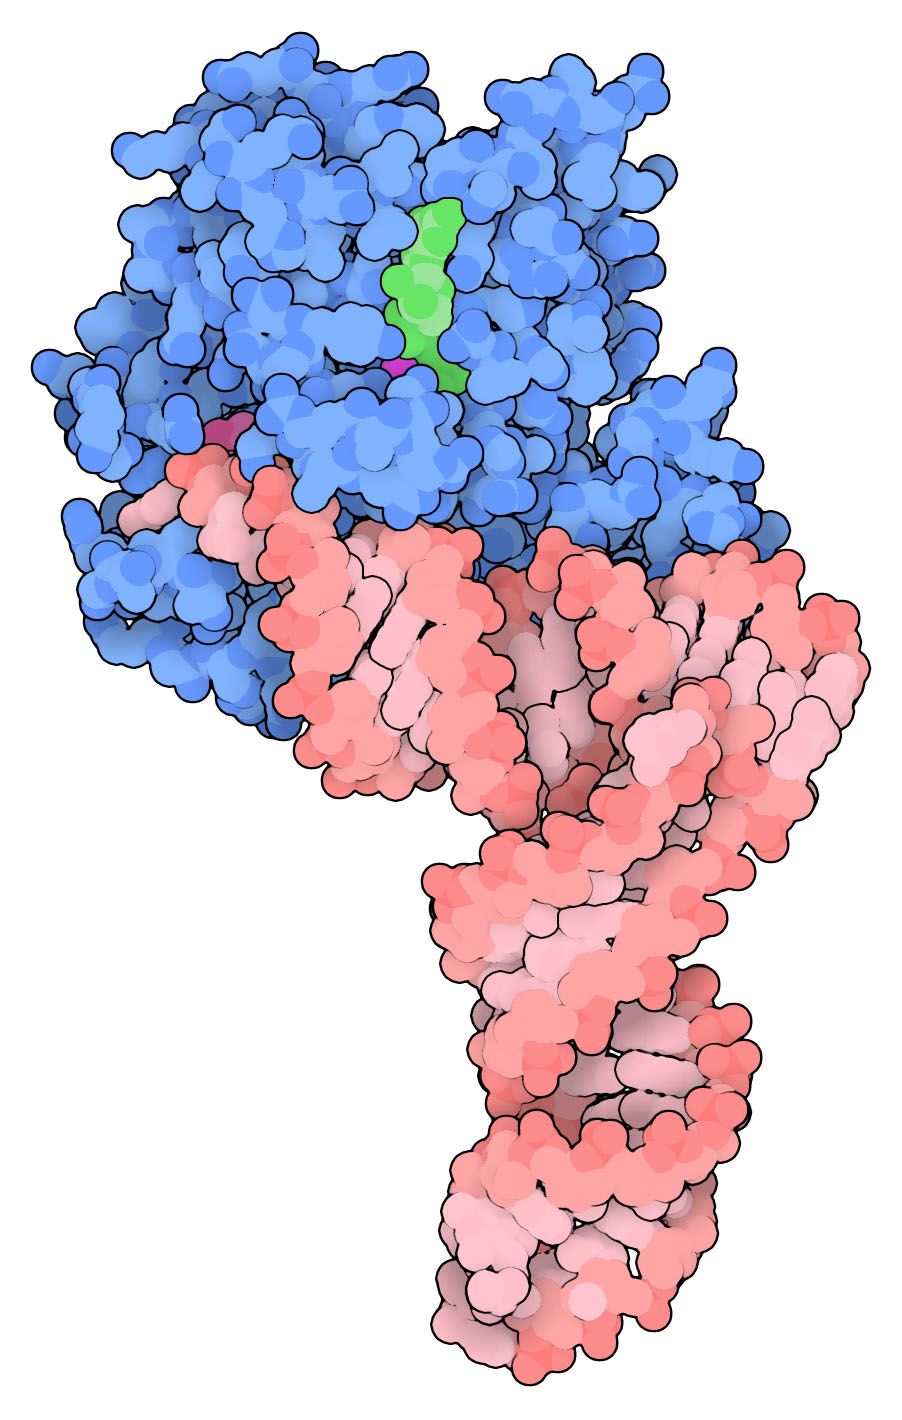
Illustrate: Non-photorealistic Biomolecular Illustration
Illustrate is a small Fortran program for creating non-photorealistic illustrations of molecules, with cartoony colors and outlines, and soft ambient shadows. I originally developed it during postdoctoral training in the laboratory of Arthur J. Olson at the Scripps Research Institute, and have tinkered with it ever since. I have used it to create materials for my books and for PDB-101, the outreach portal of the RCSB Protein Data Bank, most notably, for the “Molecule of the Month.”
Several other molecular graphics methods have options for creating similar illustrations. These include:
- Mol* (default viewer at the RCSB PDB) — in the “Settings/Controls Info” window, choose Lighting->Flat and Outline->On
- Protein Imager has a style very similar to the Molecule of the Month style
- Chimera has options for silhouette edges and flat colors
With the help of Ludovic Autin, I am finally releasing a version of the program that is generally useable. Ludo has designed a great web interface (below) that allows you to position a molecule from the PDB using NGL, and then create an illustration. I am also releasing the Fortran code (for free use and with many apologies) for users who want to get their hands dirty and customize their illustrations.
I hope you enjoy creating these illustrations as much as I do!
David S. Goodsell
Please cite:
Development of Illustrate has been kindly supported by Damon Runyon-Walter Winchell Cancer Research Fund Fellowship DRG 972, the US National Institutes of Health R01-GM120604 and the RCSB Protein Data Bank.
Known issues:
Illustrate is legacy code that was not designed for display of the amazing huge structures that are being determined these days. This is unfortunately causing many problems with users. Most importantly, the current program and web interface do not work with cif files. Since the RCSB recently decided to stop supporting split PDB files for large structures, legacy programs such as this are not able to handle many of the large protein structures that are available in the archive. Also, the program has trouble with files with many chains or many atoms.
Alexander Rose recently released his Mol* program at the RCSB site, with a very nice capability to create cartoony images like the ones from Illustrate. There is a menu “Select a different viewer” at the base of the interactive viewer for every PDB entry–you can choose “mol*”, and then choose the “Toon” render style and turn on the outlines. Please give that a try if you can’t get Illustrate to work on your molecule!

Complex of tRNA with EF-Tu, PDB entry 1ttt.