Illustrate: Gallery

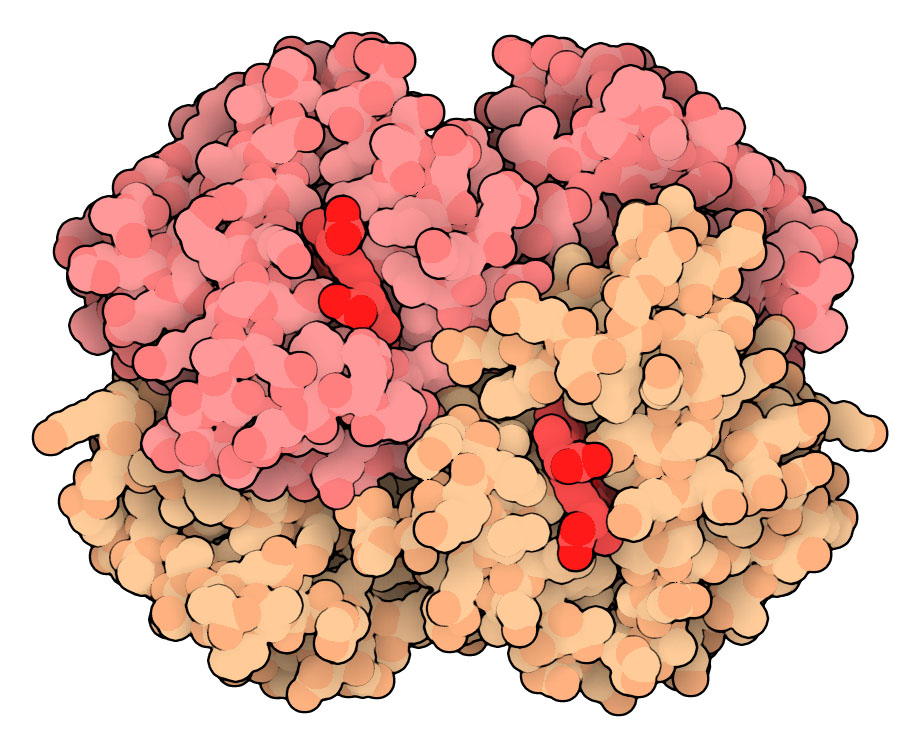
Hemoglobin (PDB entry 2hhb) with alpha and beta chains colored differently, and hemes in brighter red. Three selection cards are included at the top to remove any water or hydrogen atoms.
read
2hhb.pdb
HETATM-----HOH-- 0,9999, 0.5,0.5,0.5, 0.0
ATOM  -H-------- 0,9999, 0.5,0.5,0.5, 0.0
ATOM  H--------- 0,9999, 0.5,0.5,0.5, 0.0
ATOM  -C-------A 0,9999, 1.0,0.6,0.6, 1.6
ATOM  -S-------A 0,9999, 1.0,0.5,0.5, 1.8
ATOM  ---------A 0,9999, 1.0,0.5,0.5, 1.5
ATOM  -C-------C 0,9999, 1.0,0.6,0.6, 1.6
ATOM  -S-------C 0,9999, 1.0,0.5,0.5, 1.8
ATOM  ---------C 0,9999, 1.0,0.5,0.5, 1.5
ATOM  -C-------- 0,9999, 1.0,0.8,0.6, 1.6
ATOM  -S-------- 0,9999, 1.0,0.7,0.5, 1.8
ATOM  ---------- 0,9999, 1.0,0.7,0.5, 1.5
HETATMFE---HEM-- 0,9999, 1.0,0.8,0.0, 1.8
HETATM-C---HEM-- 0,9999, 1.0,0.3,0.3, 1.6
HETATM-----HEM-- 0,9999, 1.0,0.1,0.1, 1.5
END
center
auto
trans
0.,0.,0.
scale
12.0
zrot
90.
wor
1.0,1.0,1.0,1.0,1.0,1.0,1.0,1.0
1,0.0023,2.0,1.0,0.2
-30,-30
illustrate
3.0,10.0,4,0.0,5.0
3.0,10.0
3.0,8.0,6000.
calculate
2hhb.pnm

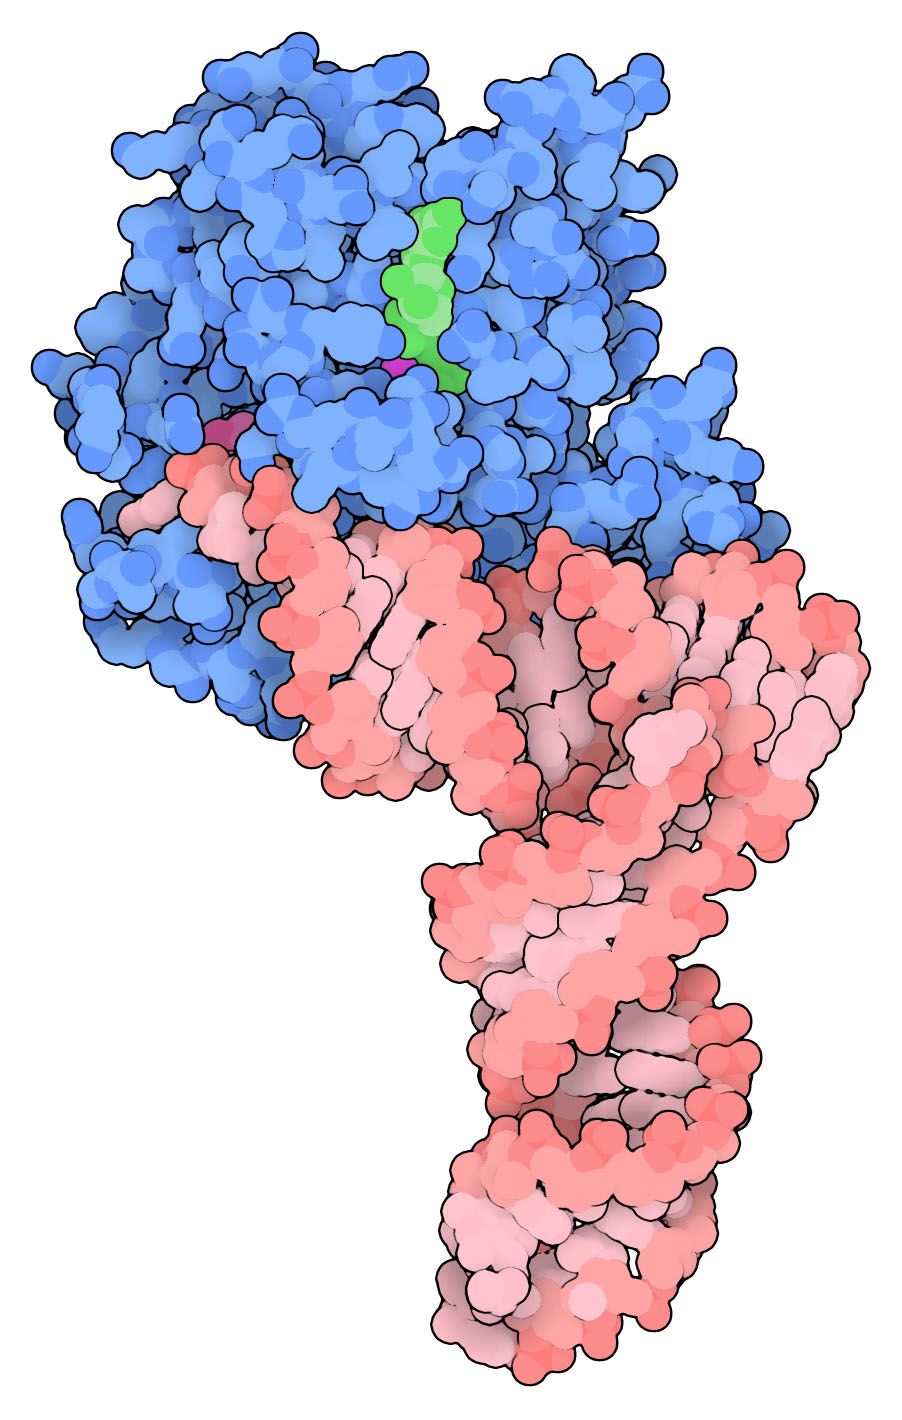
Transfer RNA and EF-Tu (PDB entry 1ttt, biological assembly 1). Selection cards are chosen carefully to get several effects:

  • Active site magnesium is selected early, and other magnesiums omitted in the following card, so that HETATM selections with wildcards may be used later.
  • Residue name is used to specify the phenylalanine attached to the tRNA.
  • Both ATOM and HETATM selections need to be included for the tRNA so that non-standard nucleotides are shown.
read
1ttt.pdb1
HETATM-----HOH-- 0,9999,  0.00, 0.00, 0.00, 0.0
ATOM  -H-------- 0,9999,  0.00, 0.00, 0.00, 0.0
ATOM  H--------- 0,9999,  0.00, 0.00, 0.00, 0.0
HETATMMG-------- 407,407, 1.00, 0.30, 1.00, 1.6
HETATMMG-------- 0,9999,  1.00, 0.30, 1.00, 0.0
ATOM  -P-------D 0,9999,  1.00, 0.49, 0.49, 1.8
ATOM  -O3'-----D 0,9999,  1.00, 0.55, 0.55, 1.5
ATOM  -O5'-----D 0,9999,  1.00, 0.55, 0.55, 1.5
ATOM  -OP------D 0,9999,  1.00, 0.55, 0.55, 1.5
ATOM  ---'-----D 0,9999,  1.00, 0.65, 0.65, 1.6
ATOM  -C-------D 0,9999,  1.00, 0.77, 0.81, 1.6
ATOM  ---------D 0,9999,  1.00, 0.75, 0.79, 1.6
HETATM-C---PHE-D 0,9999,  1.00, 0.50, 0.80, 1.6
HETATM-----PHE-D 0,9999,  1.00, 0.40, 0.70, 1.6
HETATM-P-------D 0,9999,  1.00, 0.49, 0.49, 1.8
HETATM-O3'-----D 0,9999,  1.00, 0.55, 0.55, 1.5
HETATM-O5'-----D 0,9999,  1.00, 0.55, 0.55, 1.5
HETATM-OP------D 0,9999,  1.00, 0.55, 0.55, 1.5
HETATM---'-----D 0,9999,  1.00, 0.65, 0.65, 1.6
HETATM-C-------D 0,9999,  1.00, 0.77, 0.81, 1.6
HETATM---------D 0,9999,  1.00, 0.75, 0.79, 1.6
ATOM  -C-------A 0,9999,  0.50, 0.70, 1.00, 1.6
ATOM  ---------A 0,9999,  0.40, 0.60, 1.00, 1.5
HETATM-C---GNP-A 0,9999,  0.60, 0.90, 0.60, 1.6
HETATM-----GNP-A 0,9999,  0.40, 0.90, 0.40, 1.5
HETATM---------- 0,9999,  0.50, 0.50, 0.50, 0.0
END
center 
auto
trans
0.,0.,0.
scale
12.0
zrot
-25.
xrot
-90.
wor
1.0,1.0,1.0,1.0,1.0,1.0,1.0,1.0
1,0.0023,2.0,1.,0.7
-30,-30
illustrate
3.,10.,4,0.,5.
3.,10.
3.,8.,6.
calculate
1ttt.pnm

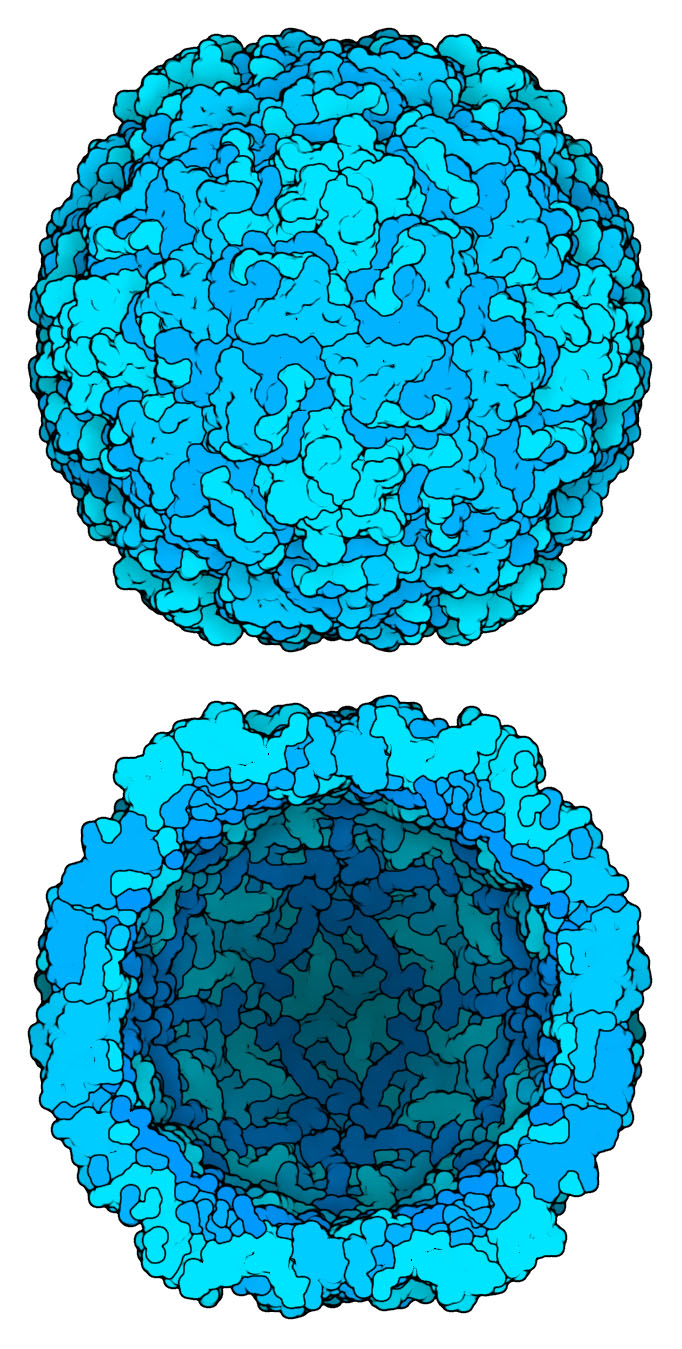
Rhinovirus capsid (PDB entry 4rhv, biological assembly 1) drawn using only alpha carbons with a 5A radius. Subunit outlines to give an overall feel for the assembly.

In the second image, the “center” option of the “center” command places the virus on the z=0 plane, so the upper portion of the molecule is clipped away. A dark fog is used to give the shading inside.
read
4rhv.pdb1
ATOM  -CA------1 0,9999, 0.0,0.9,1.0, 5.0
ATOM  -CA------2 0,9999, 0.0,0.8,1.0, 5.0
ATOM  -CA------3 0,9999, 0.0,0.7,1.0, 5.0
ATOM  -CA------4 0,9999, 0.0,0.6,1.0, 5.0
END
center
auto
trans
0.,0.,0.
scale
2.0
wor
1.0,1.0,1.0,1.0,1.0,1.0,1.0,1.0
1,0.0023,2.0,1.0,0.2
-30,-30
illustrate
5.0,15.0,4,0.0,5.0
3.0,10.0
3.0,8.0,6000.
calculate
4rhv.pnm
read
4rhv.pdb1
ATOM  -CA------1 0,9999, 0.0,0.9,1.0, 5.0
ATOM  -CA------2 0,9999, 0.0,0.8,1.0, 5.0
ATOM  -CA------3 0,9999, 0.0,0.7,1.0, 5.0
ATOM  -CA------4 0,9999, 0.0,0.6,1.0, 5.0
END
center
center
trans
0.,0.,0.
scale
2.0
wor
1.0,1.0,1.0,0.0,0.0,0.0,1.0,0.3
1,0.0023,2.0,1.0,0.2
-30,-30
illustrate
5.0,15.0,4,0.0,5.0
3.0,10.0
3.0,8.0,6000.
calculate
4rhv_2.pnm

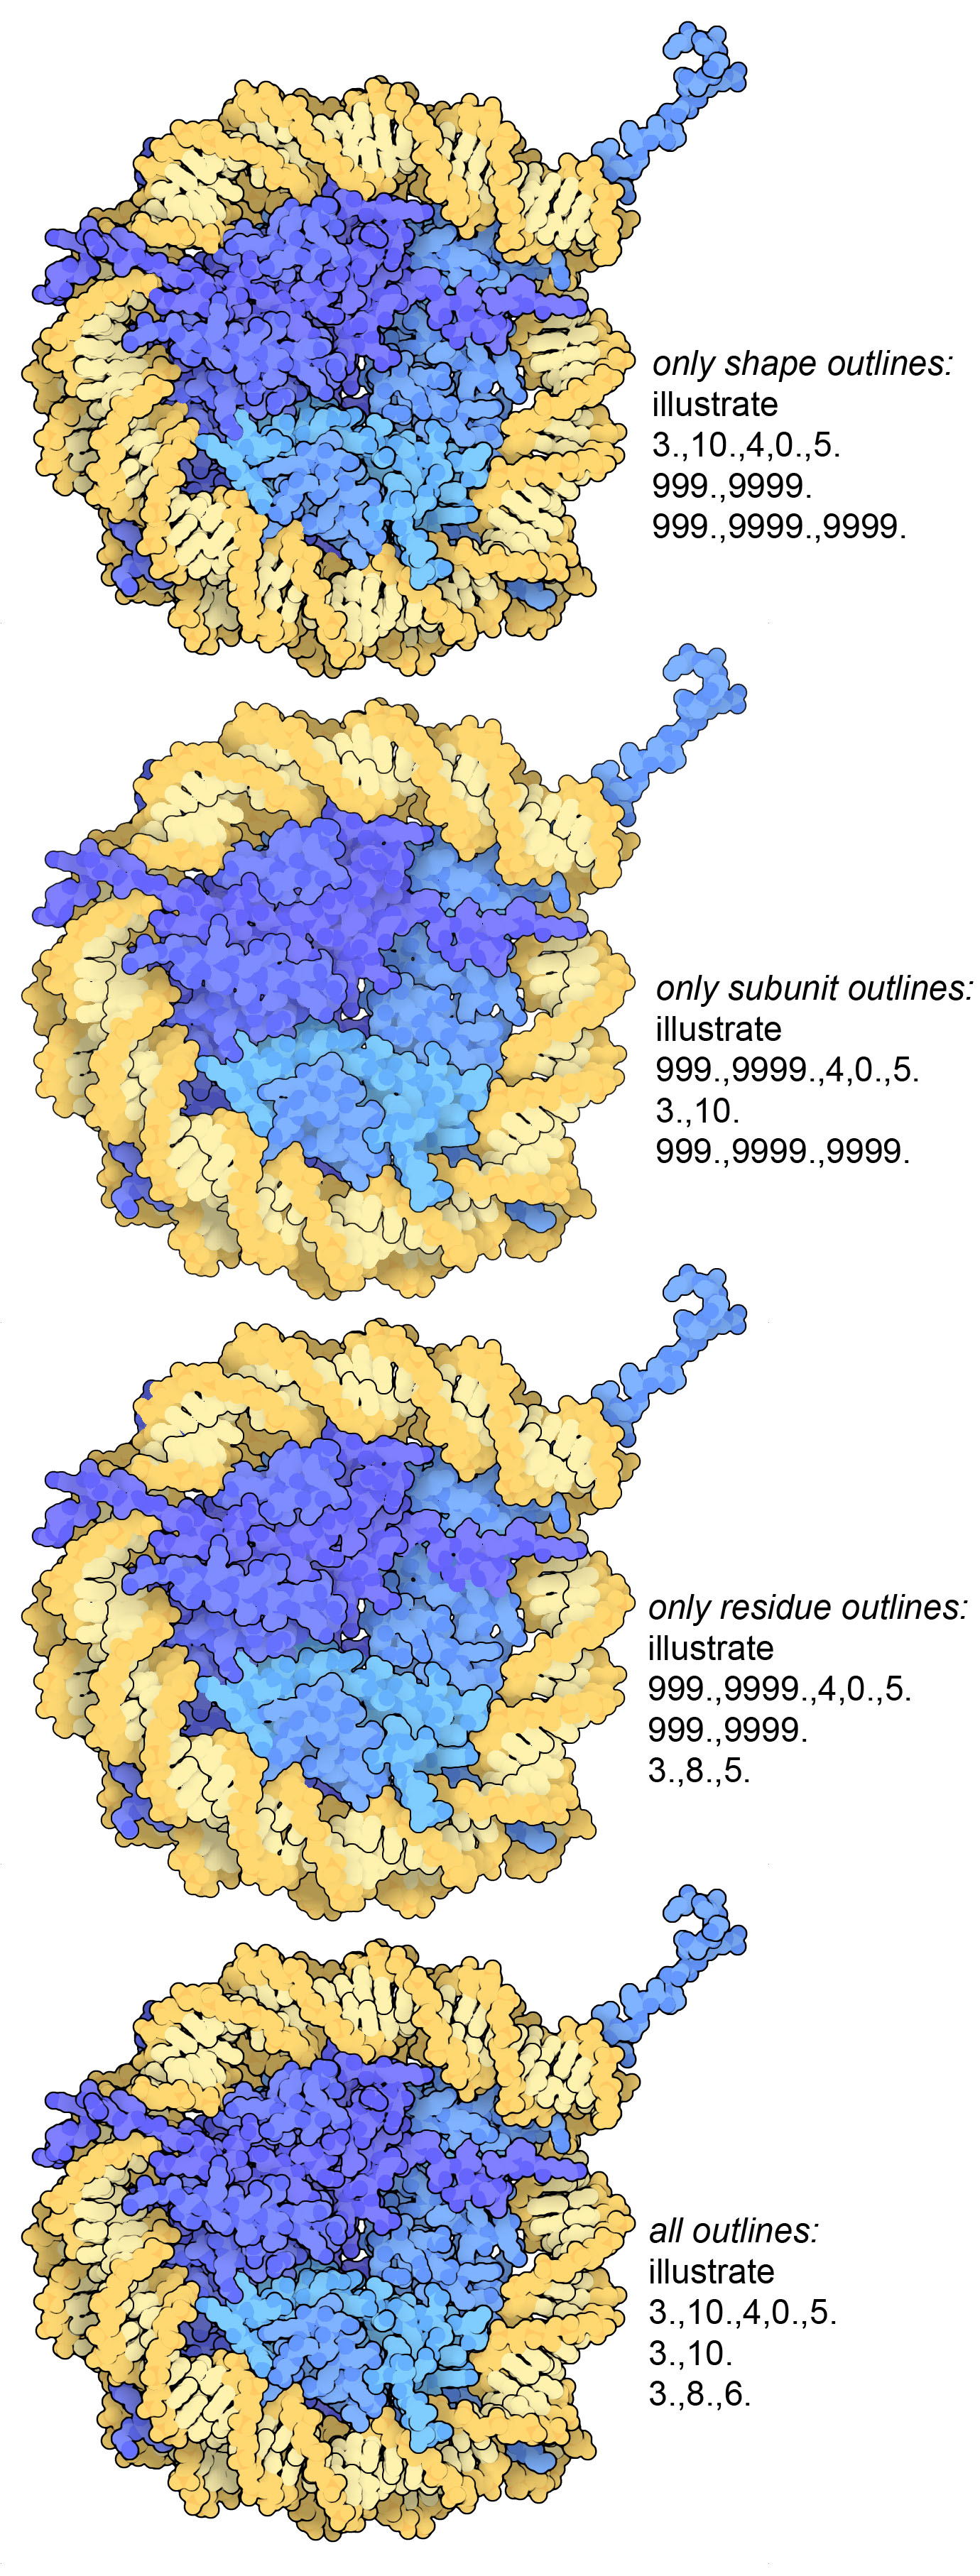
Nucleosome (PDB entry 1aoi) drawn using different options for the outlines. Notice that the first image (shape outlines) is missing separation between the two strands of the DNA, which are added using the subunit outlines. The residue outlines give a little more structure to folded protein chains. The script for the full picture is given below.
read
1aoi.pdb
HETATM-----HOH-- 0,9999, 0.5,0.5,0.5, 0.0
ATOM -H-------- 0,9999, 1.0,1.0,1.0, 0.0
ATOM H--------- 0,9999, 1.0,1.0,1.0, 0.0
ATOM -P-------I 0,9999 1.00, 0.79, 0.39, 1.8
ATOM -O3'-----I 0,9999 1.00, 0.85, 0.45, 1.5
ATOM -O5'-----I 0,9999 1.00, 0.85, 0.45, 1.5
ATOM -OP------I 0,9999 1.00, 0.85, 0.45, 1.5
ATOM ---'-----I 0,9999 1.00, 0.85, 0.45, 1.6
ATOM ---------I 0,9999 1.00, 0.95, 0.69, 1.6
ATOM -P-------J 0,9999 1.00, 0.79, 0.39, 1.8
ATOM -O3'-----J 0,9999 1.00, 0.85, 0.45, 1.5
ATOM -O5'-----J 0,9999 1.00, 0.85, 0.45, 1.5
ATOM -OP------J 0,9999 1.00, 0.85, 0.45, 1.5
ATOM ---'-----J 0,9999 1.00, 0.85, 0.45, 1.6
ATOM ---------J 0,9999 1.00, 0.95, 0.69, 1.6
ATOM -C-------A 0,9999 0.50, 0.70, 1.00, 1.6
ATOM ---------A 0,9999 0.40, 0.60, 1.00, 1.5
ATOM -C-------E 0,9999 0.50, 0.70, 1.00, 1.6
ATOM ---------E 0,9999 0.40, 0.60, 1.00, 1.5
ATOM -C-------B 0,9999 0.50, 0.80, 1.00, 1.6
ATOM ---------B 0,9999 0.40, 0.70, 1.00, 1.5
ATOM -C-------F 0,9999 0.50, 0.80, 1.00, 1.6
ATOM ---------F 0,9999 0.40, 0.70, 1.00, 1.5
ATOM -C-------C 0,9999 0.50, 0.50, 1.00, 1.6
ATOM ---------C 0,9999 0.40, 0.40, 1.00, 1.5
ATOM -C-------G 0,9999 0.50, 0.50, 1.00, 1.6
ATOM ---------G 0,9999 0.40, 0.40, 1.00, 1.5
ATOM -C-------D 0,9999 0.50, 0.55, 1.00, 1.6
ATOM ---------D 0,9999 0.40, 0.45, 1.00, 1.5
ATOM -C-------H 0,9999 0.50, 0.55, 1.00, 1.6
ATOM ---------H 0,9999 0.40, 0.45, 1.00, 1.5
END
center 
auto
trans
0.,0.,0.
scale
8.0
wor
1.0,1.0,1.0,1.0,1.0,1.0,1.0,1.0
1,0.0023,2.0,1.,0.7
-30,-30
illustrate
3.,10.,4,0.,5.
3.,10.
3.,8.,6.
calculate
1aoi.pnm

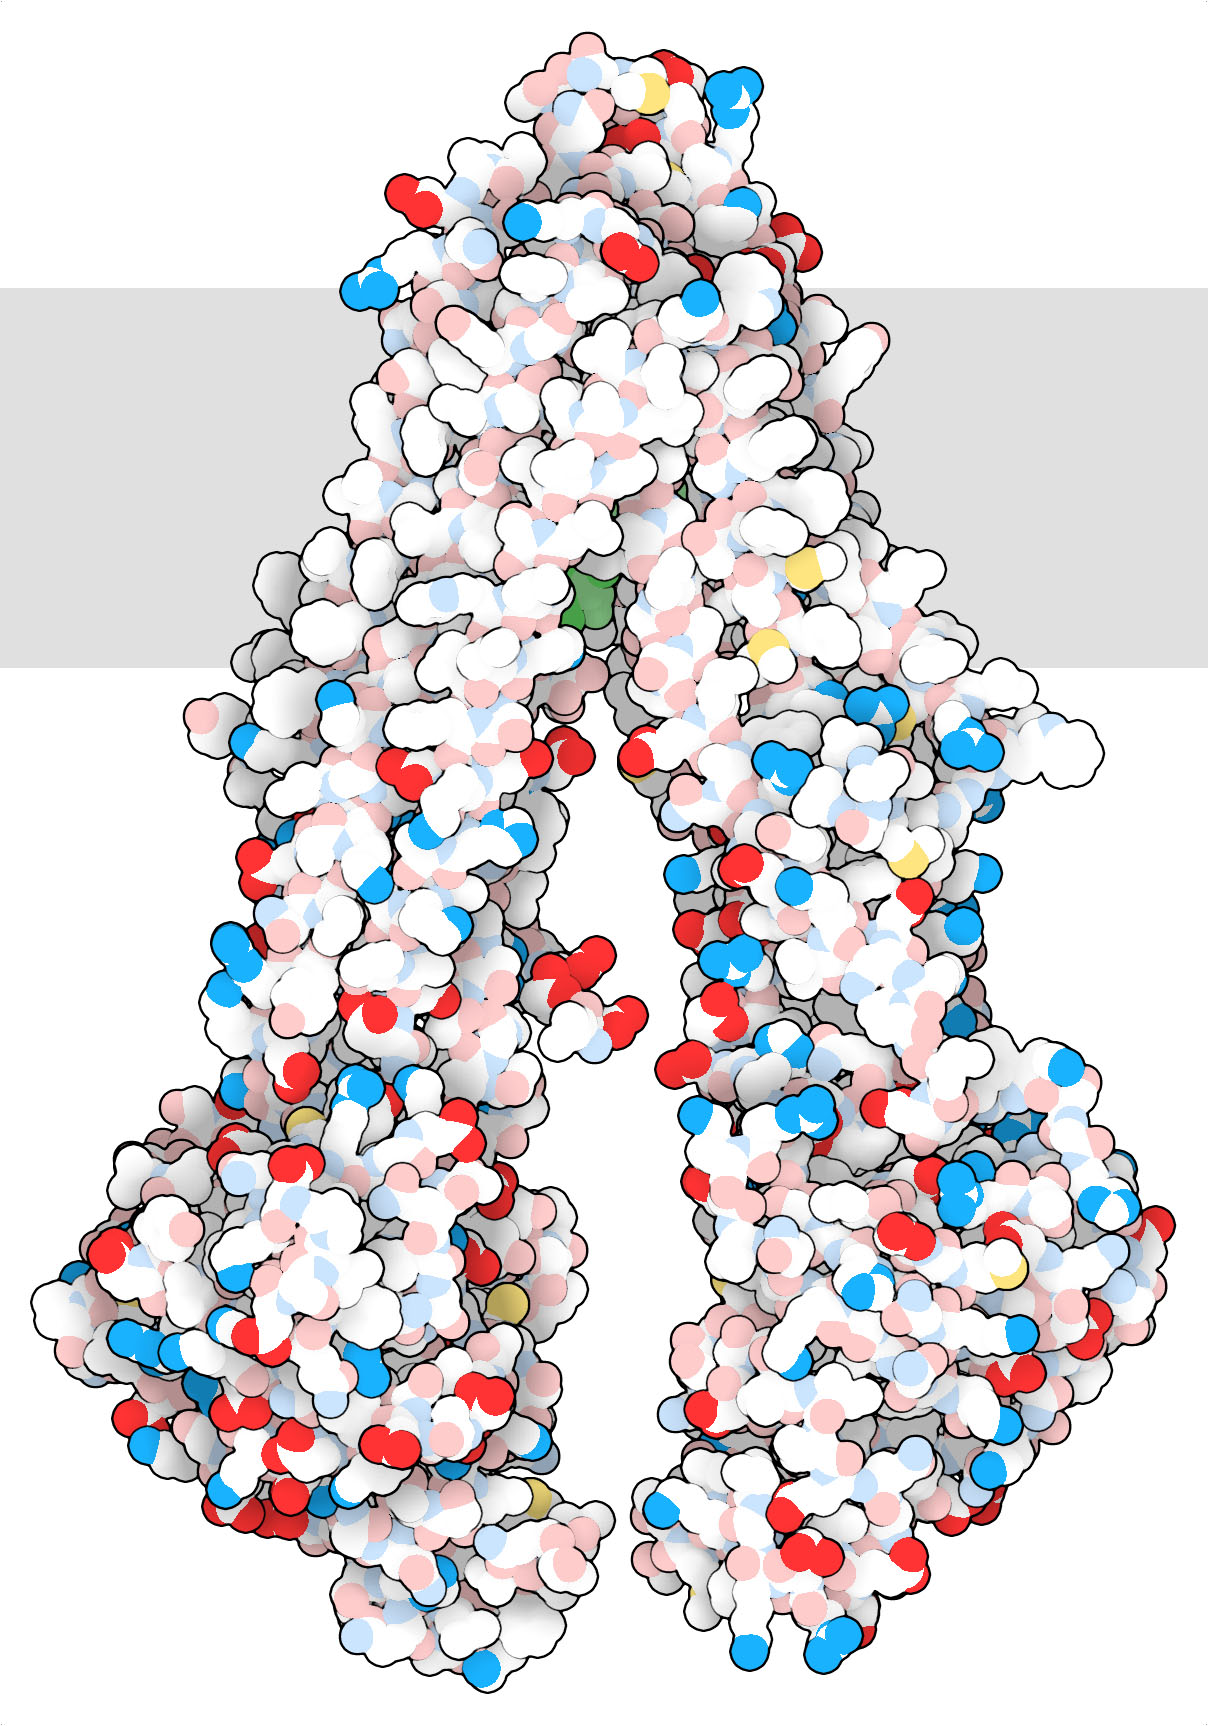
P-glycoprotein (PDB entry 3gp61) drawn using the WWW interface of Illustrate with the “Atomic” style. This style has bright colors for oxygen and nitrogen atoms with formal charges, such as the acidic oxygens in aspartate and glutamate and the basic nitrogens in lysine, arginine and histidine. Other oxygens and nitrogens, such as the ones in serine and glutamine, are in pastel colors. Notice how the region that spans the membrane (highlighted with a schematic gray bar) doesn’t include charged amino acids.

Hemoglobin crystal (PDB entry 2hhb) drawn using the WWW interface of Illustrate with the “Supercell” Assembly. A few changes were made to the default script, including making the atoms a bit larger, coloring the beta chains differently, and depth cueing to black.
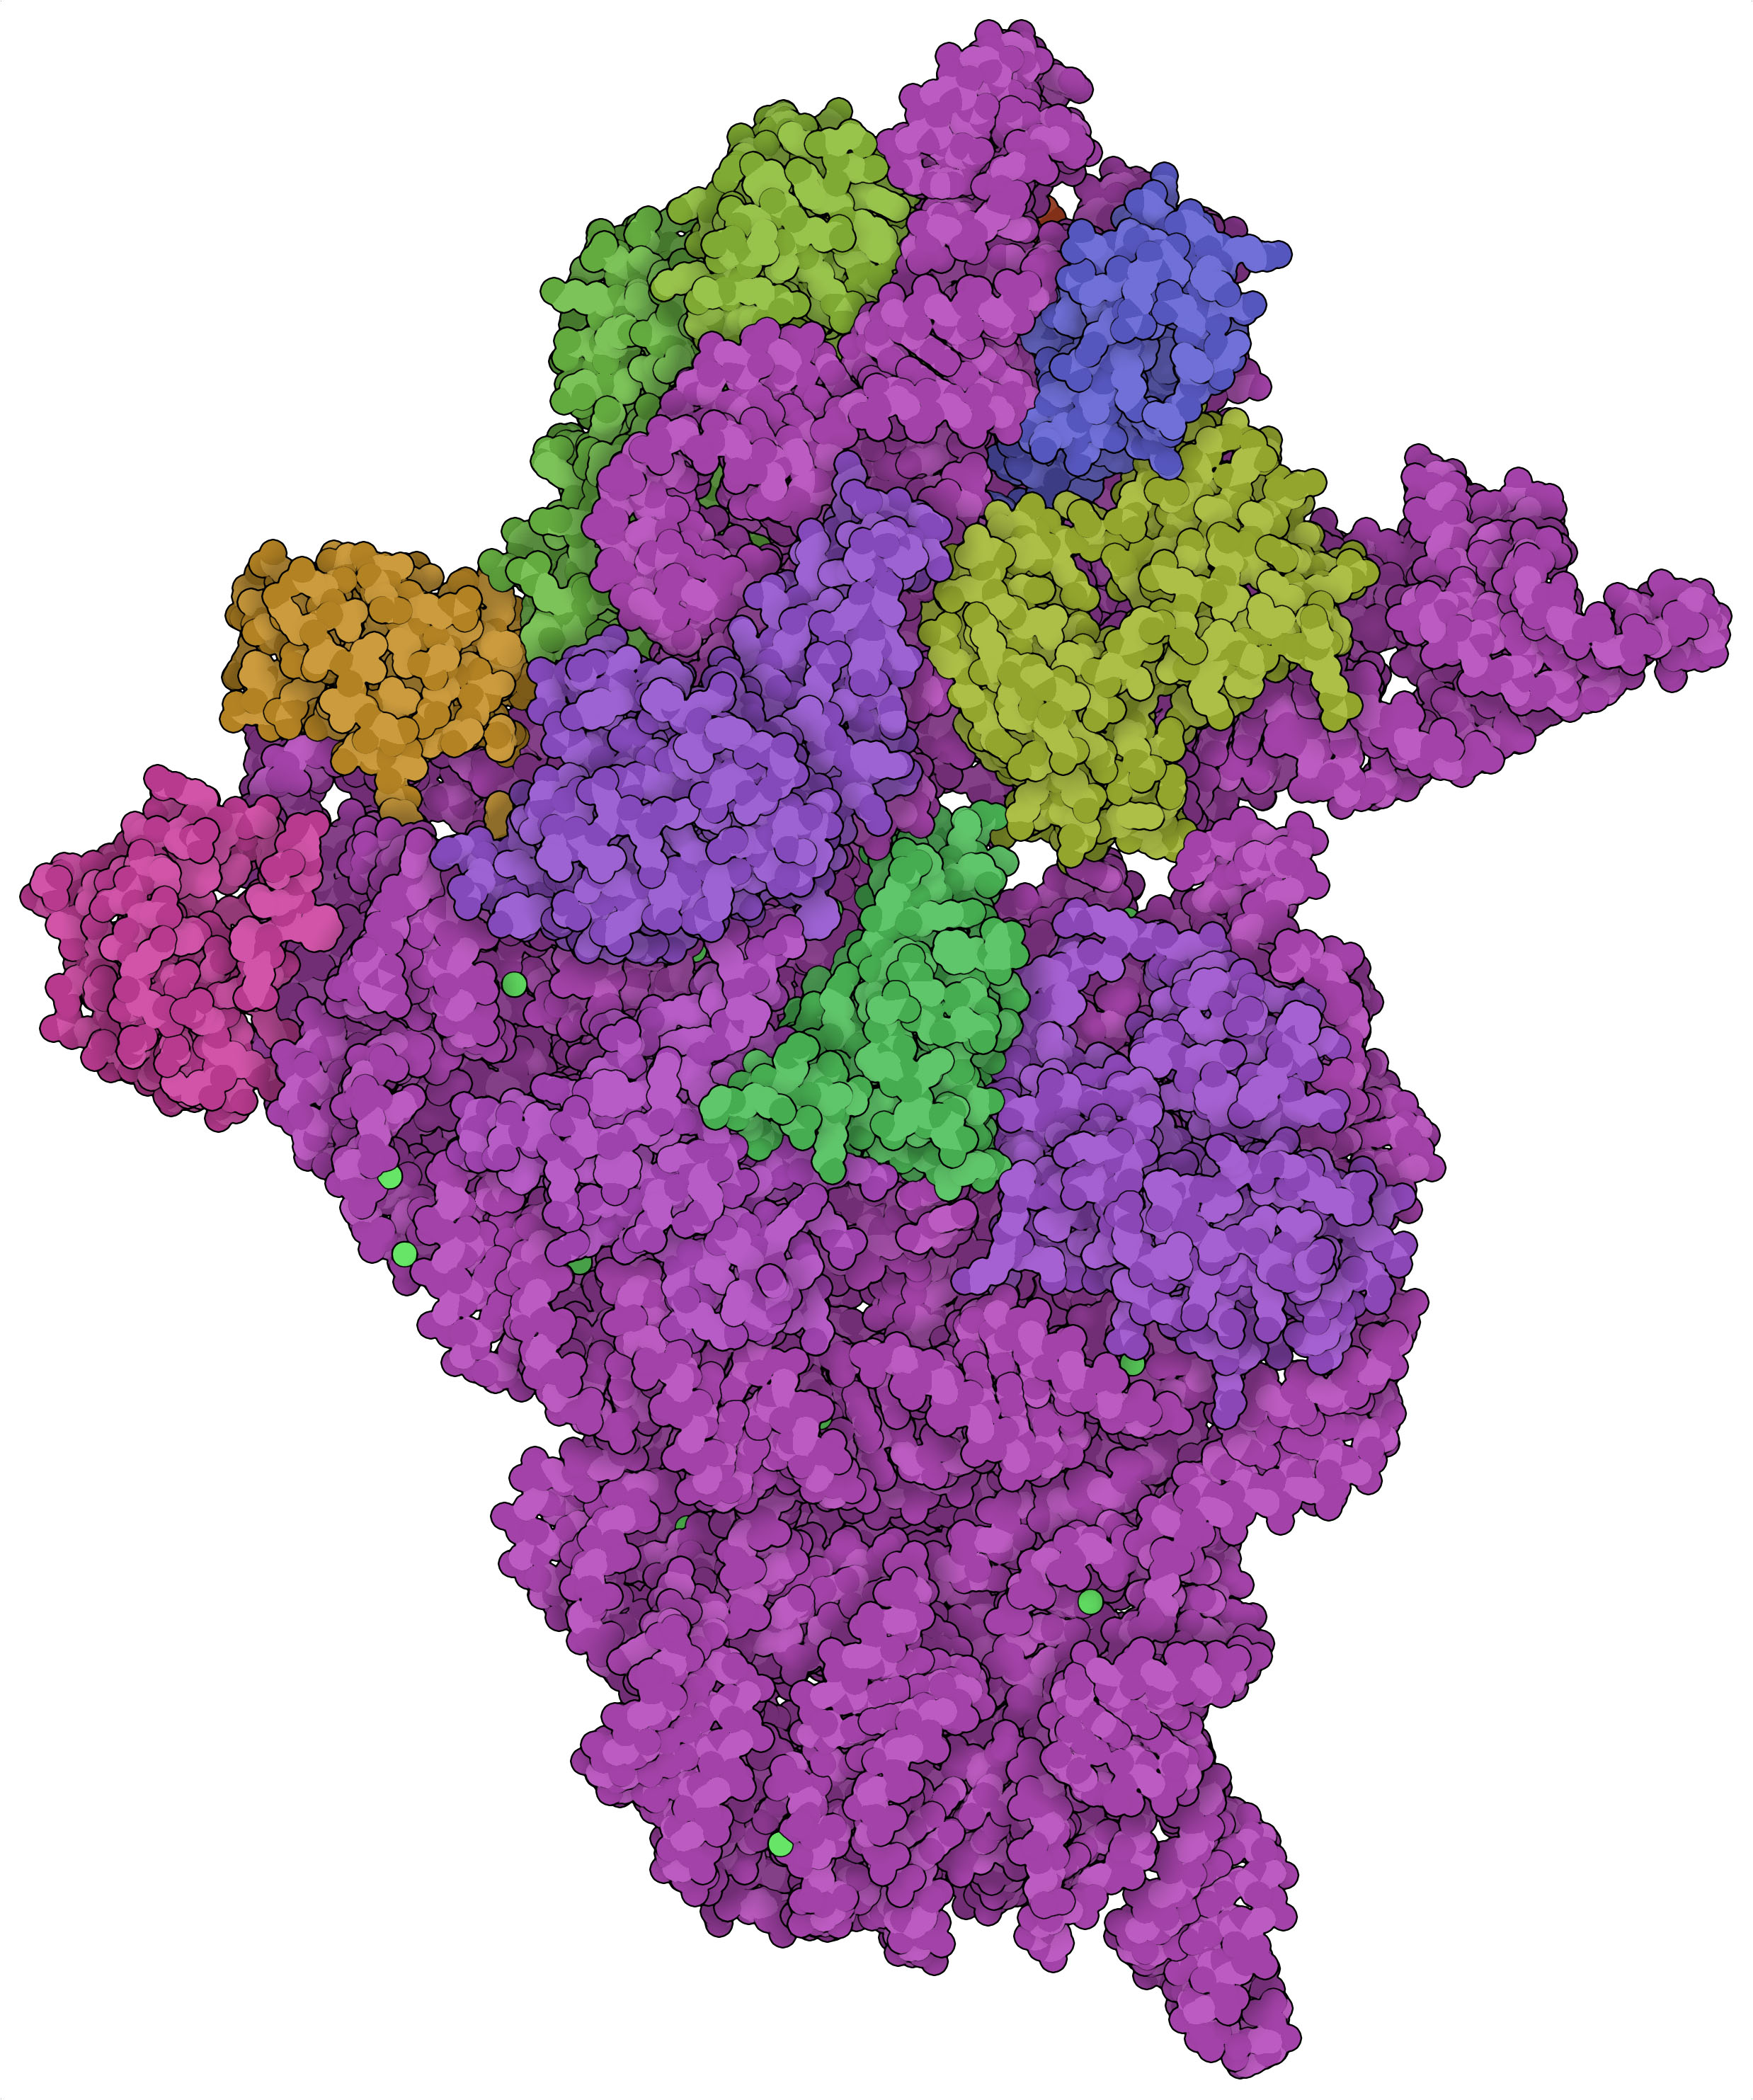
Small subunit of the ribosome (PDB entry 1fjg) drawn using the WWW interface of Illustrate with the “Entity/Chain” option.